


Advertising
12 Apple ad campaigns spanning over 40 years — The hits and misses
8 min read
By Mario Neto

Diving deep into Instagram and Facebook ad trends from 2021 to 2023. See how costs changed and prepare with our predictions for 2024, including seasonal impacts and strategic tips.
We analyzed data from the past three years (2021–2023) of Facebook ad campaigns targeting various demographics and interests in the US. Interestingly, we observed consistent trends across key metrics like CPM and CPC.
Advertising costs on Facebook have dropped significantly over the past three years and are expected to decline further in 2024. This coincides with an increase in the Click-through rate, suggesting improved campaign effectiveness for lower investments.
Seasonality also plays a role: costs spike starting on Black Friday and reach a peak of 40% during the holidays, followed by a dip of about 20% in January and February when compared to the year average. Weekly patterns show costs rising towards the weekend and being lowest on Mondays and Tuesdays.
Check out the graphs below for a deeper dive into these trends and specific insights.
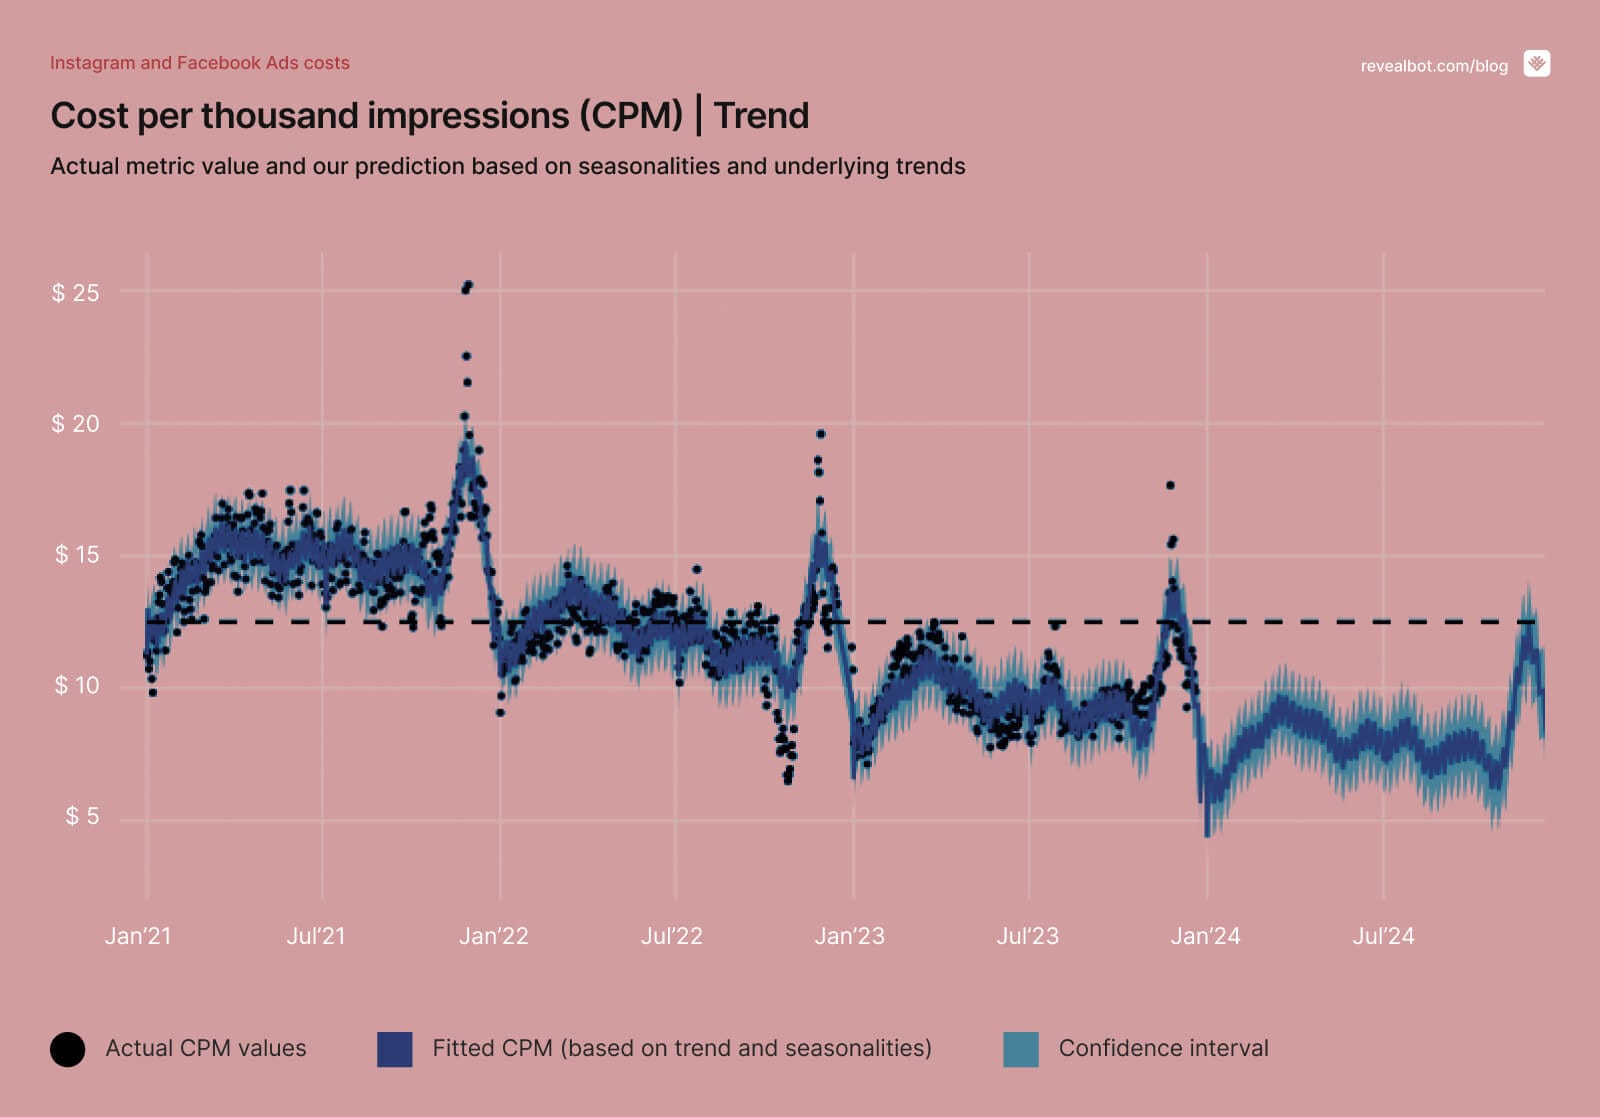
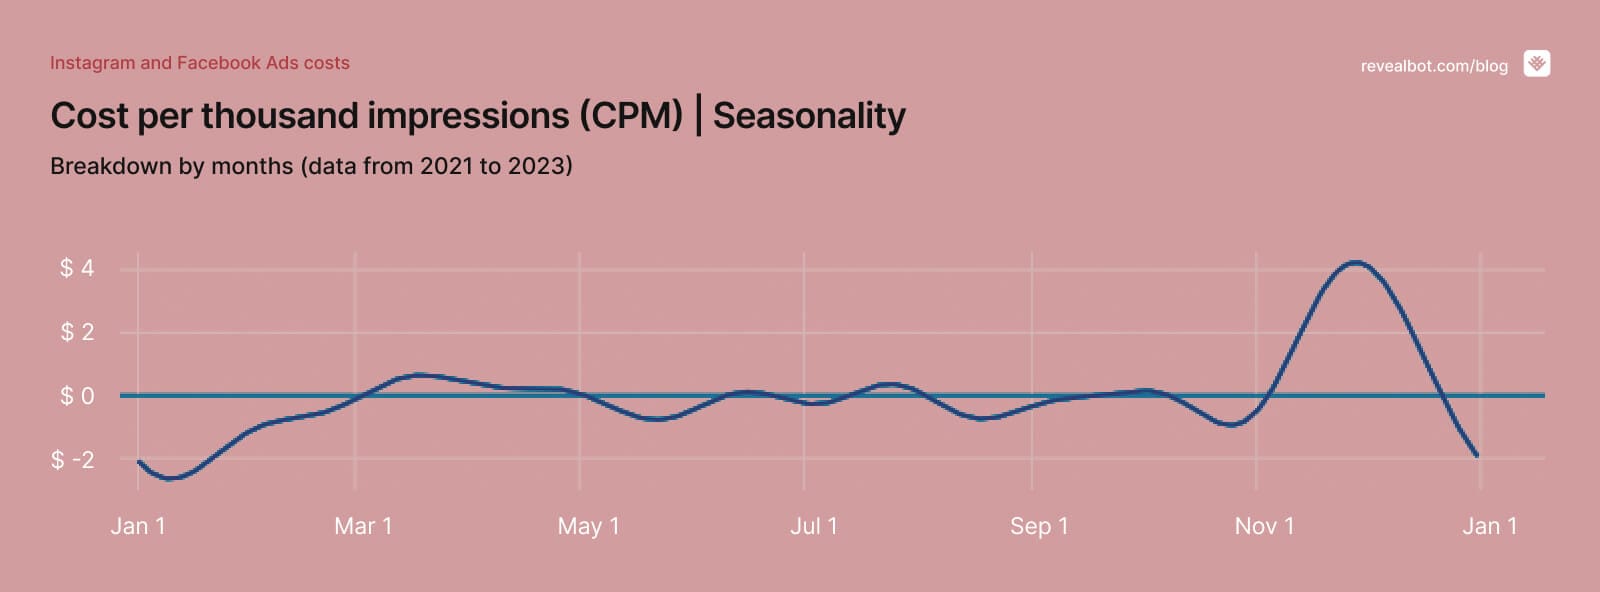
For the last three years, we have observed a slight year-over-year decrease in CPM, which is a good trend for advertisers. Therefore, we expect this trend to continue into the next year as well.
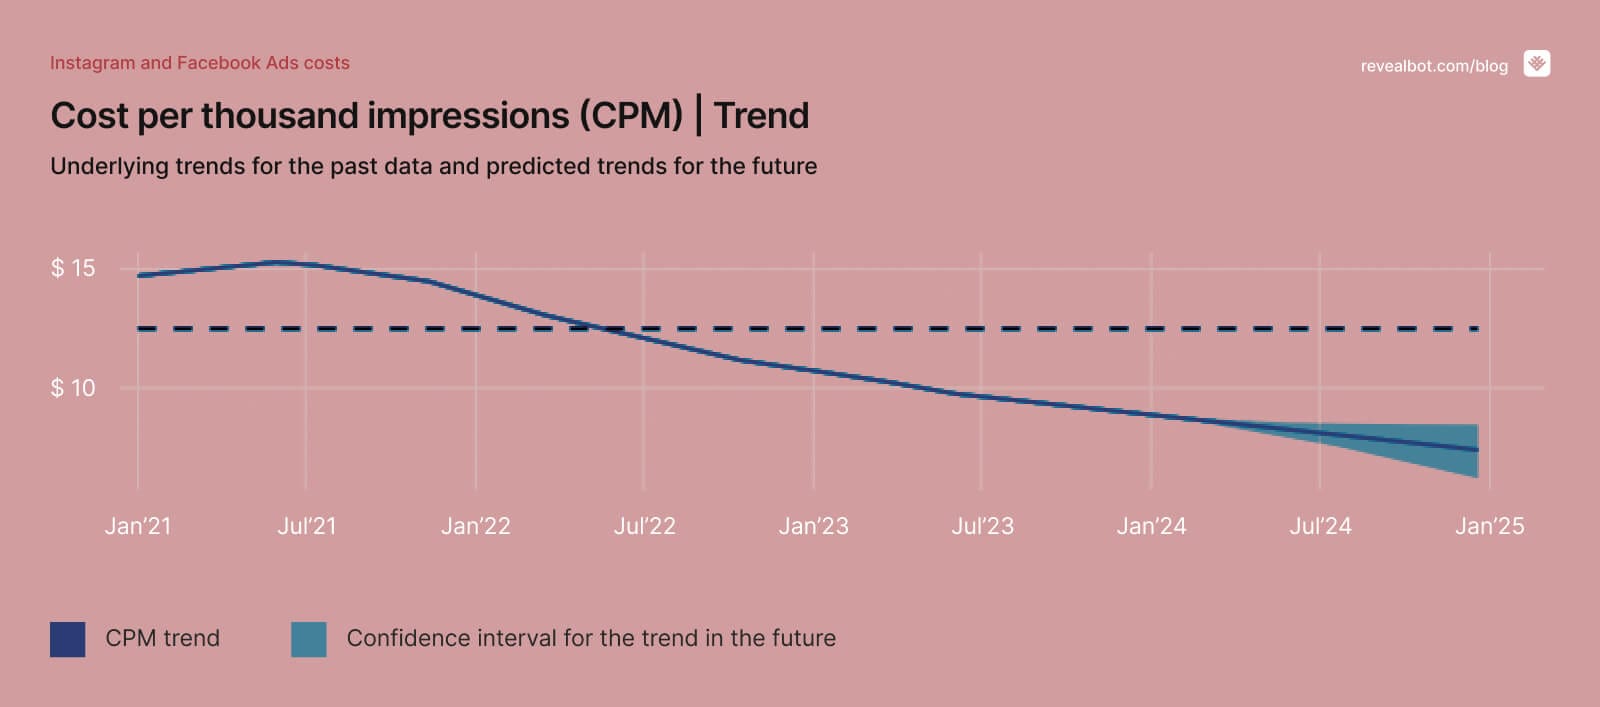
From the chart above we can see that there is a strong seasonality in CPM which looks like this:
There is a strong seasonality in CPM, characterized by peaks at the end of November, indicating that Black Friday and Christmas have the most influence on CPM. The values through the peak period are +40% higher. The least expensive impressions are available in January.
Additionally, there is a weekly seasonality, although not as pronounced. Impressions are the least expensive on Mondays, while they tend to be most expensive on Fridays and Saturdays.
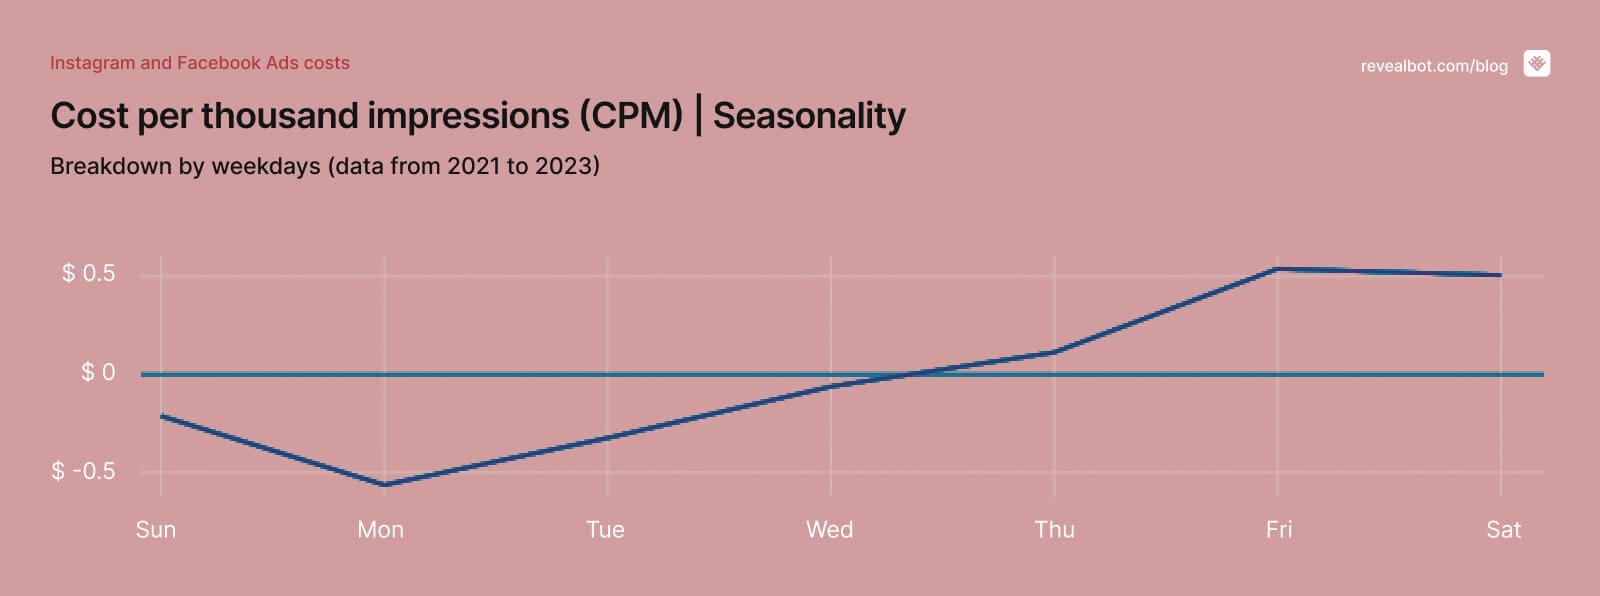
The primary hypothesis for both seasonalities is the high competition on those days.
Clicks / Impressions * 100
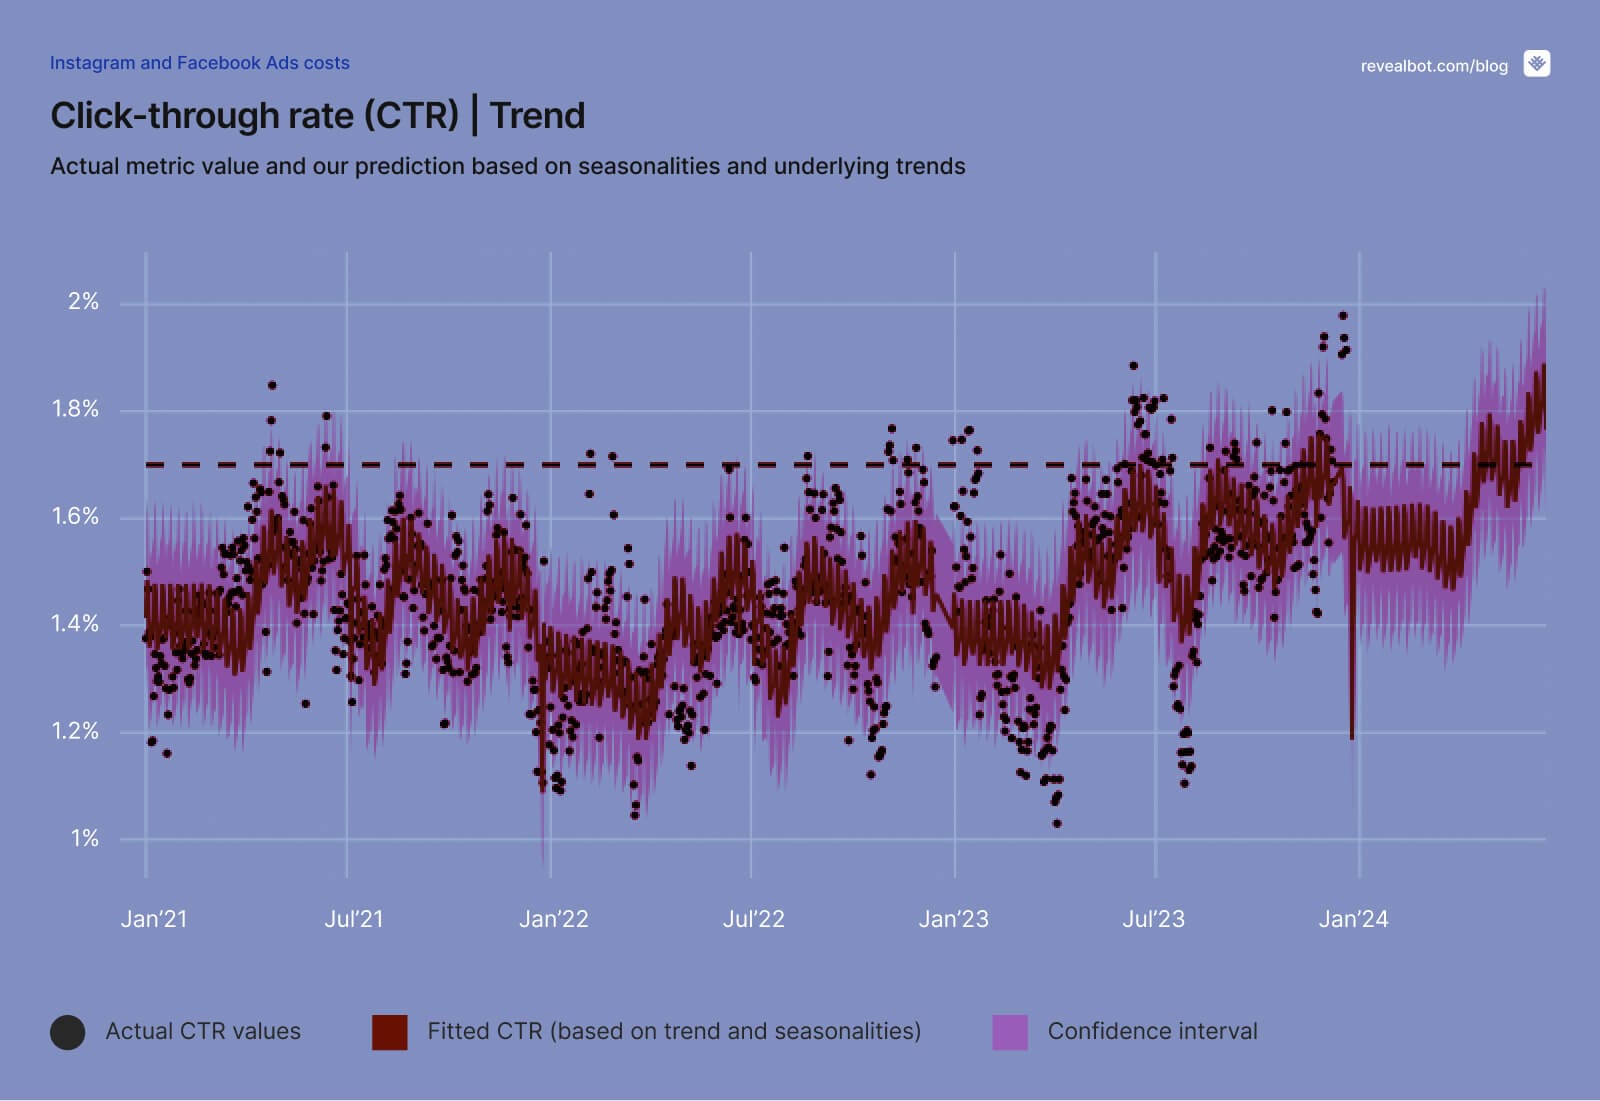
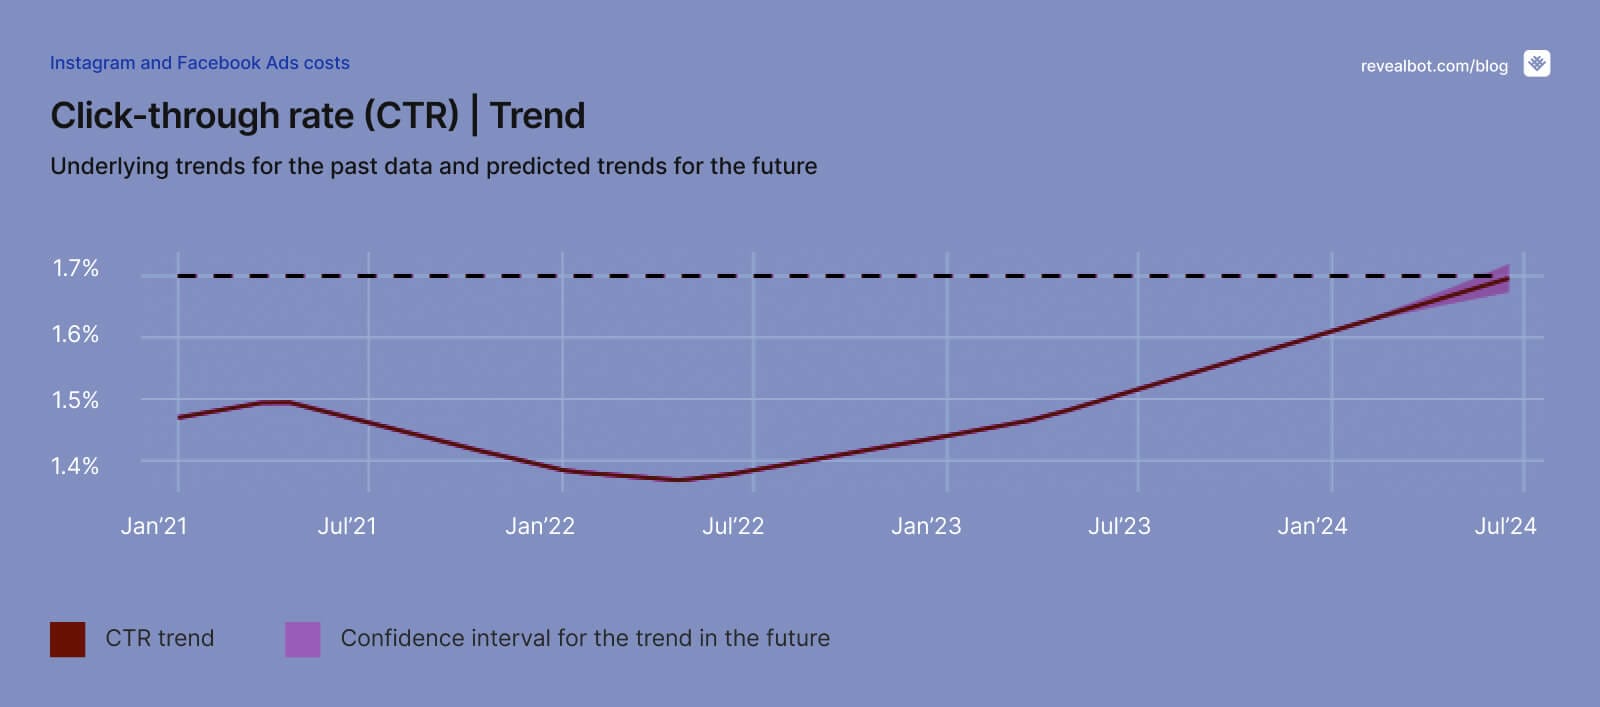
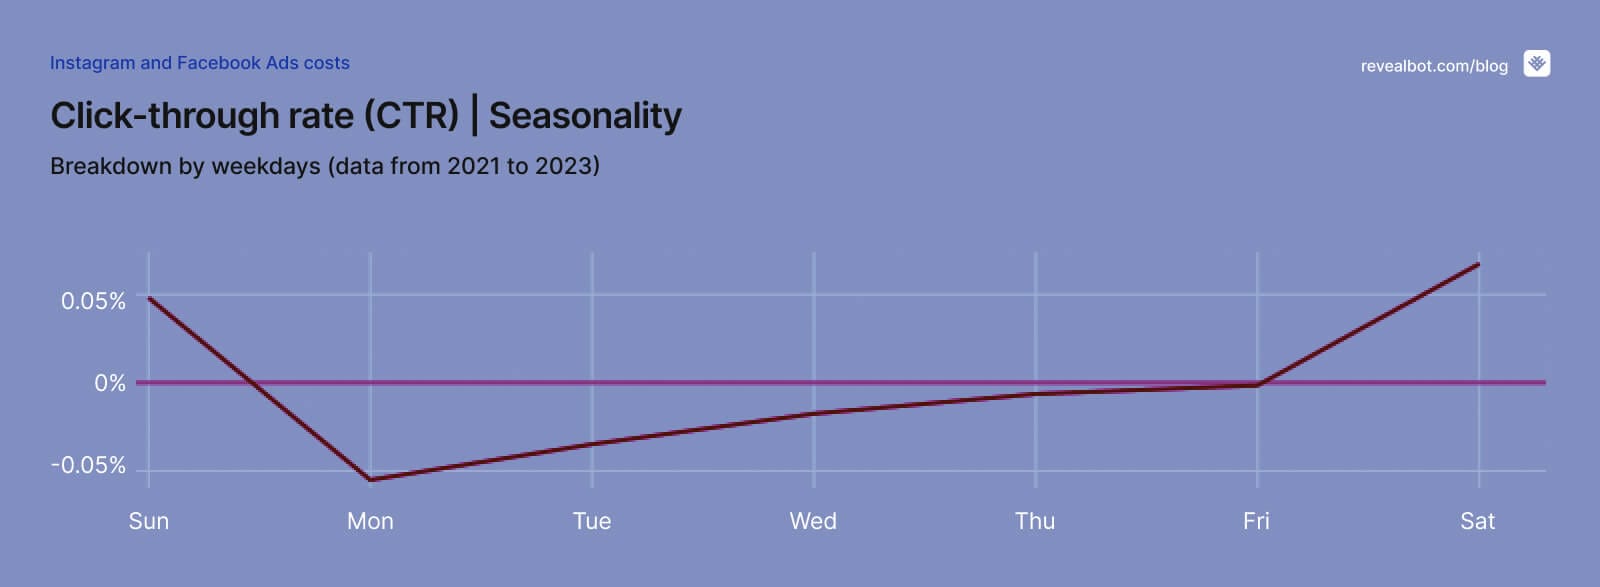
We observe a positive and consistent trend in CTR. We anticipate this trend to continue in the following year. 🙂
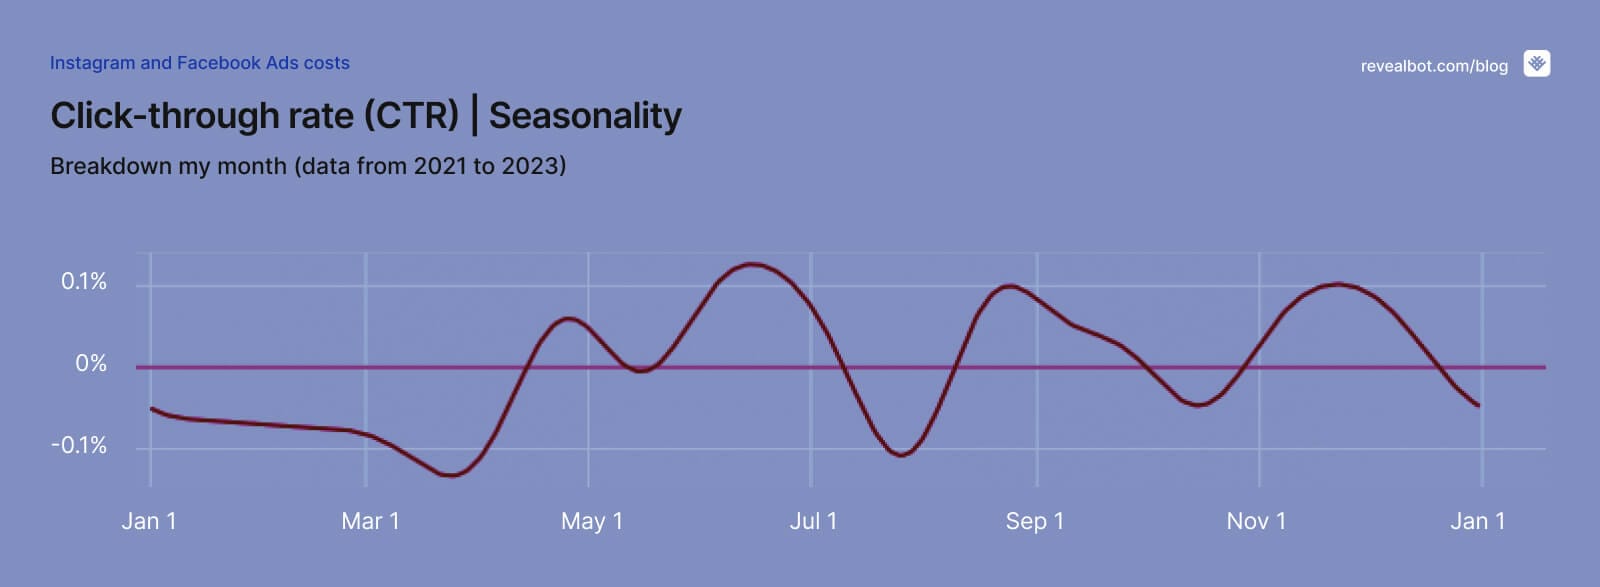
If we consider the last three years, we observe a seasonality pattern as follows: the CTR is slightly lower during the first quarter of the year (~ by 5%). Regarding weekly seasonality, we can note that the CTR is slightly better during weekends compared to weekdays.
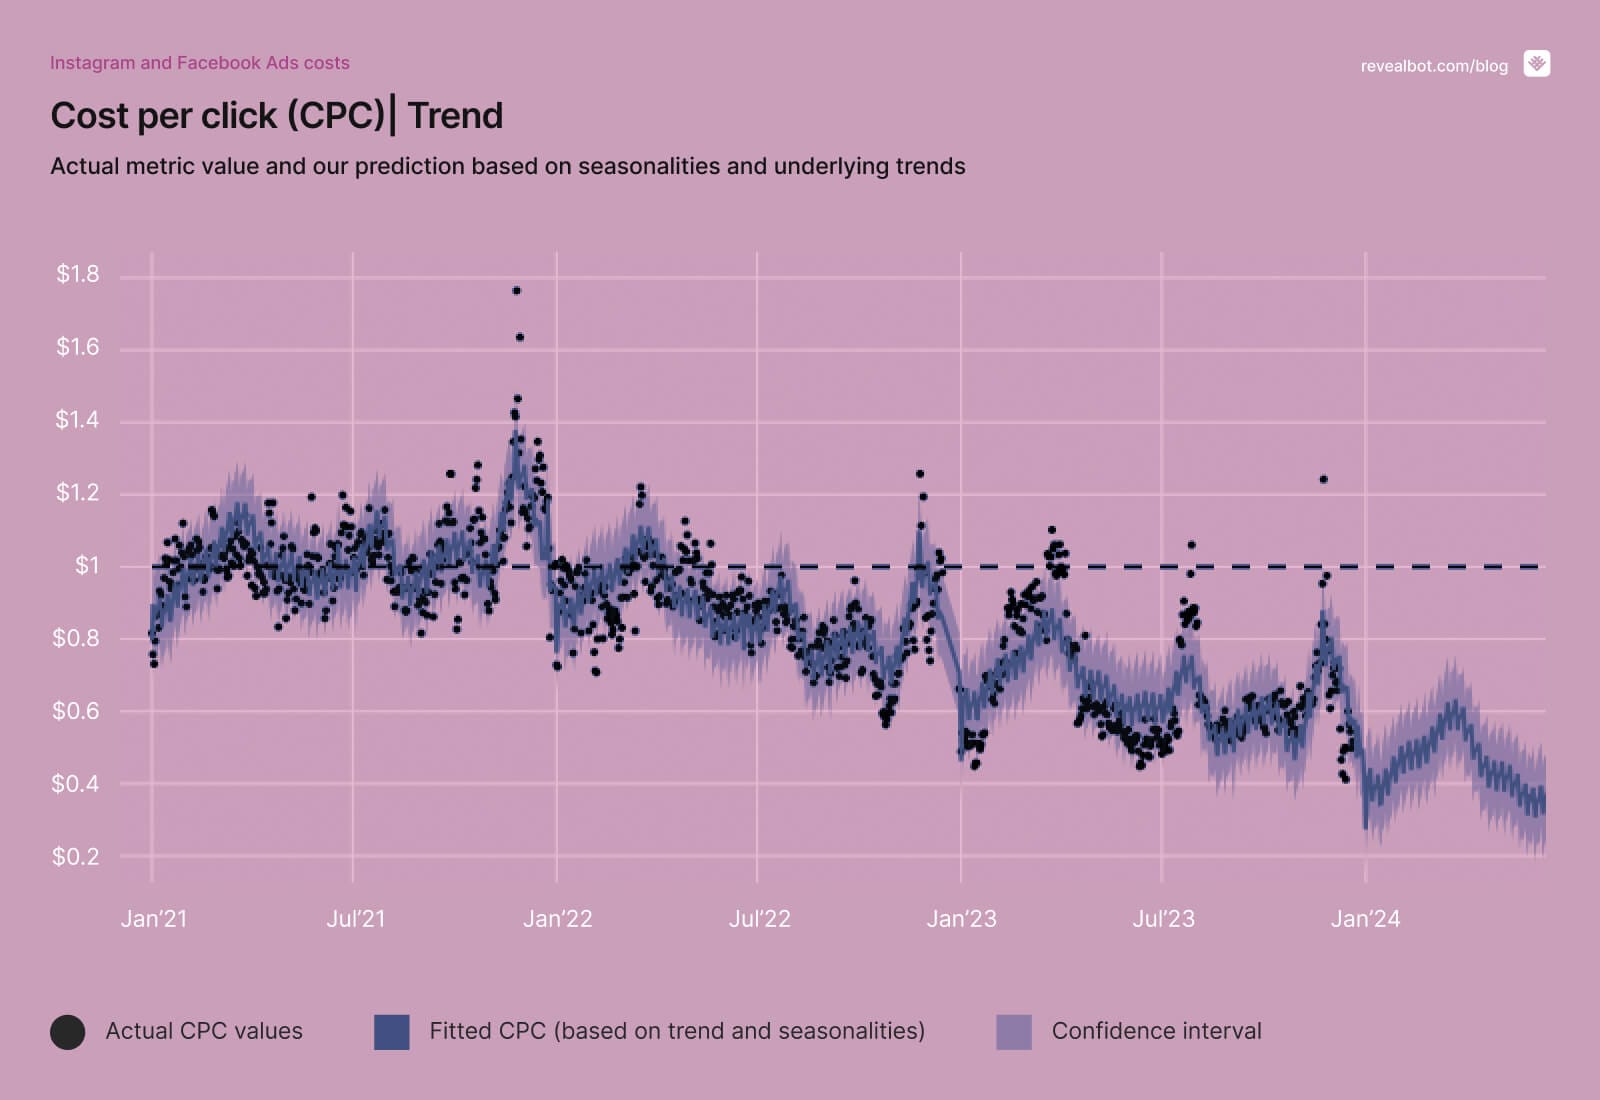
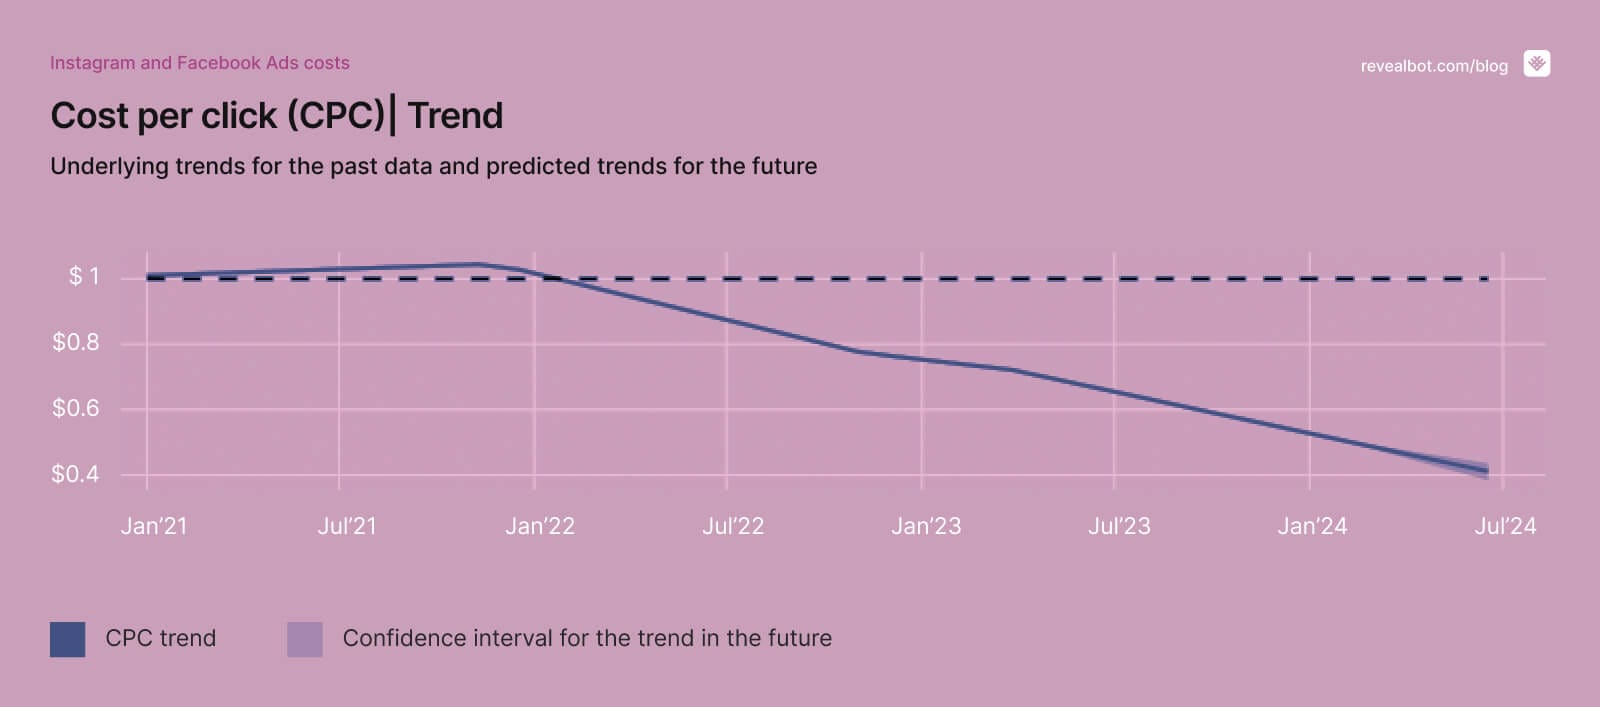
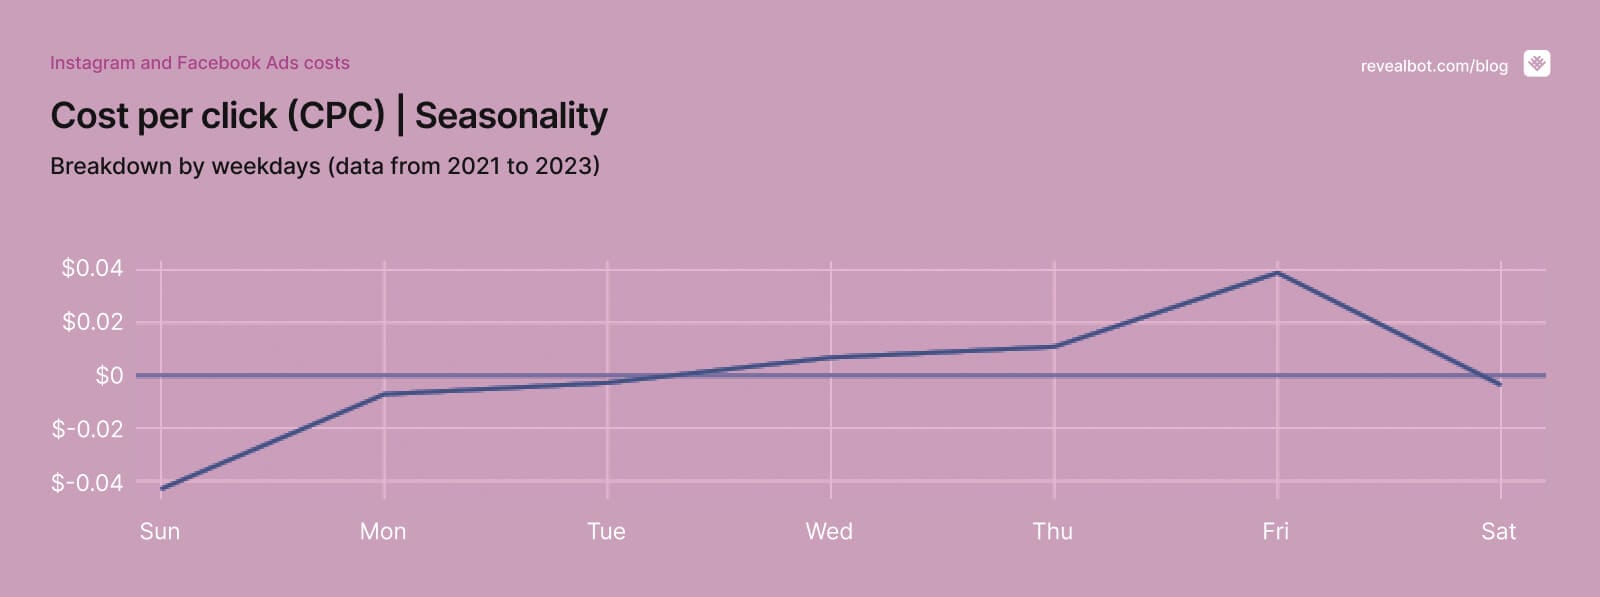
In the year 2022 we have observed a slight year-over-year decrease in CPC. Therefore, we expect that this trend may continue into the next year as well.
The peak month is November (end of November), primarily associated with Black Friday (by ~25-30%). Additionally, there are two smaller peaks at the end of March and July (the reasons for which may require further investigation). The least expensive clicks occur in January.
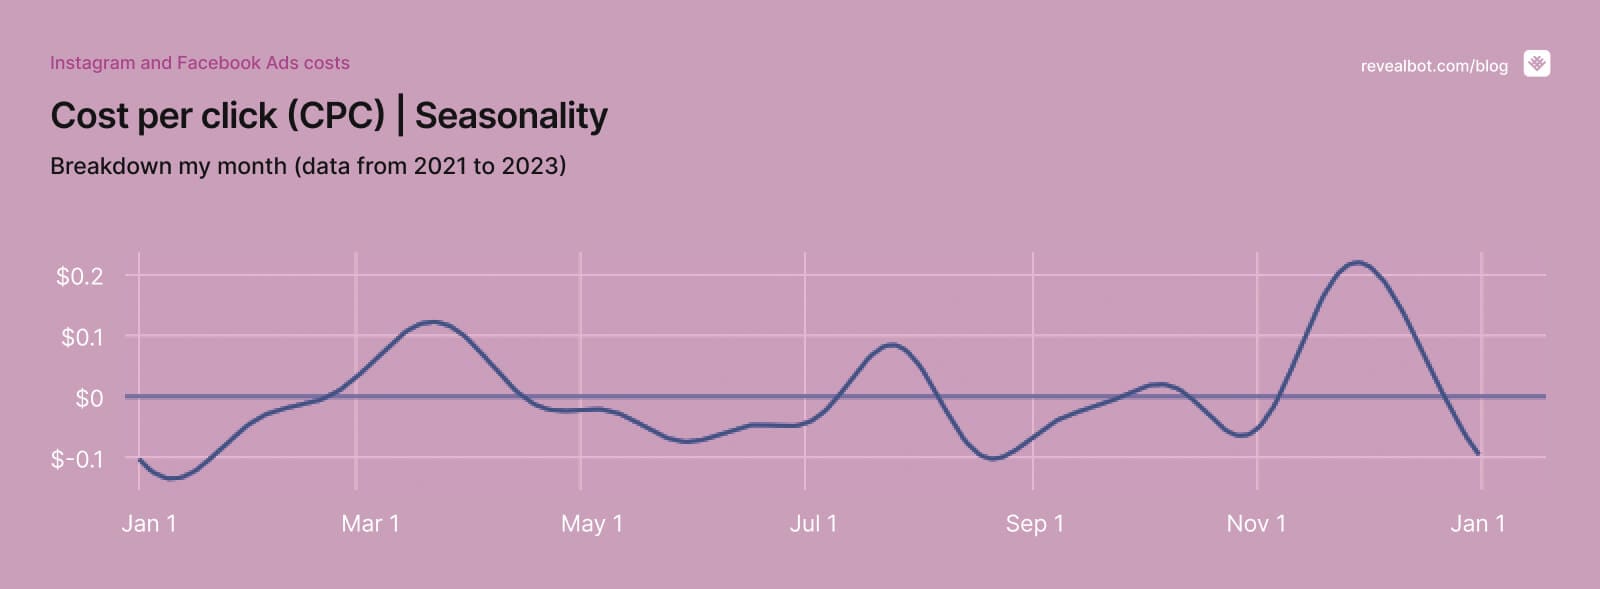
While the weekly seasonality is not very strong, the most expensive clicks are on Fridays (~5% higher), while the least expensive ones are on Sundays (~5% lower).
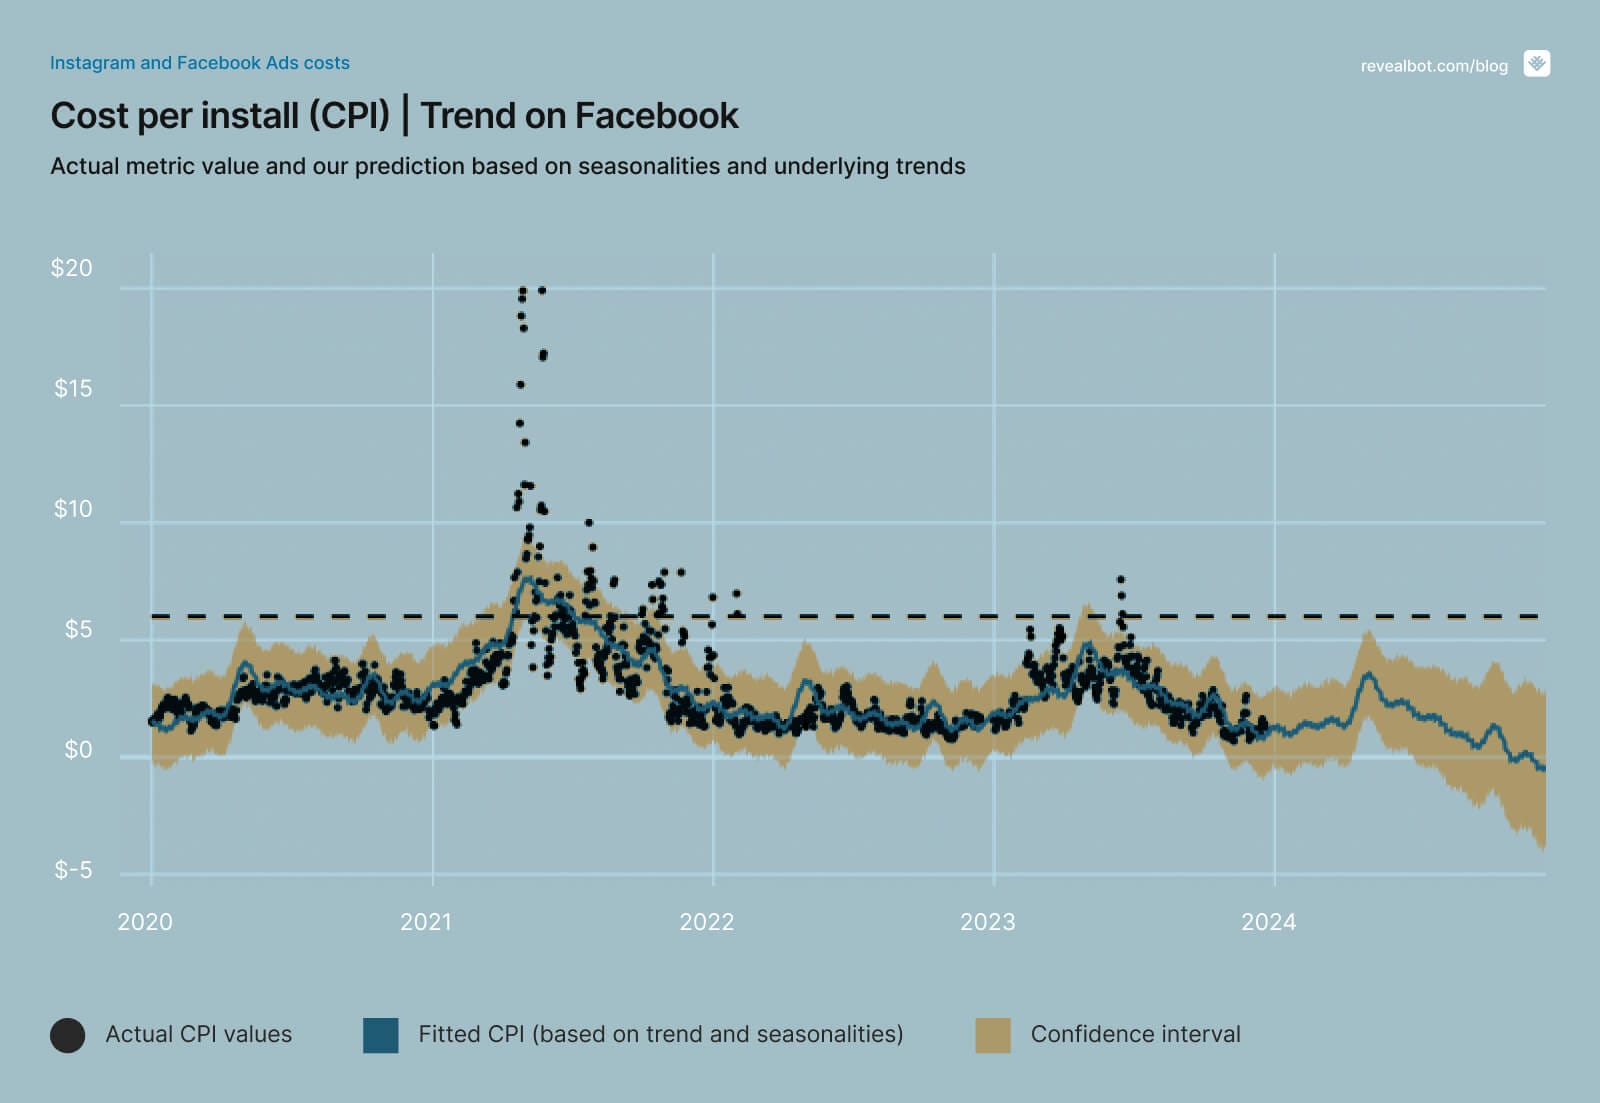
We are considering only campaigns with the App Install objective.
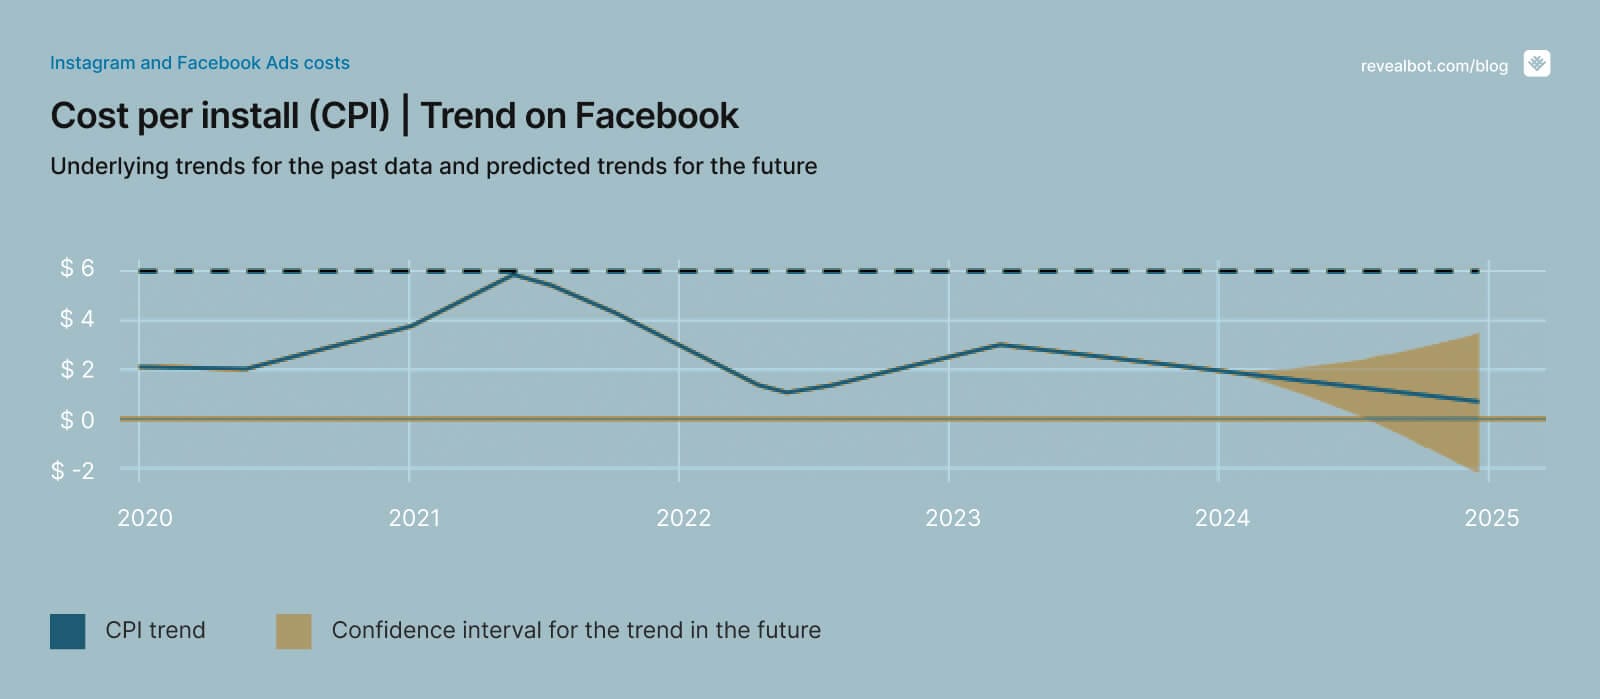
We can see a slight increase in 2023 compared to 2022. We expect similar values for the next year, but that is assuming there are no changes in regulations related to privacy on iOS/Android.
In April 2021, there was an iOS 14.5 release with IDFA restrictions, leading to a significant peak in the cost per install, which rose from $2-3 to $10-20. Although the cost per install recovered in 2022, there were still some peak values observed in 2023 likely caused by the enactment of new privacy bills in many US States such as Arizona, California, and Florida.
For Instagram, 2023 marked the year with the highest cost per install in the last four years. The peak occurred from February 2023 to May 2023. A similar peak was observed in April 2021 for the same reason as mentioned above (IDFA).
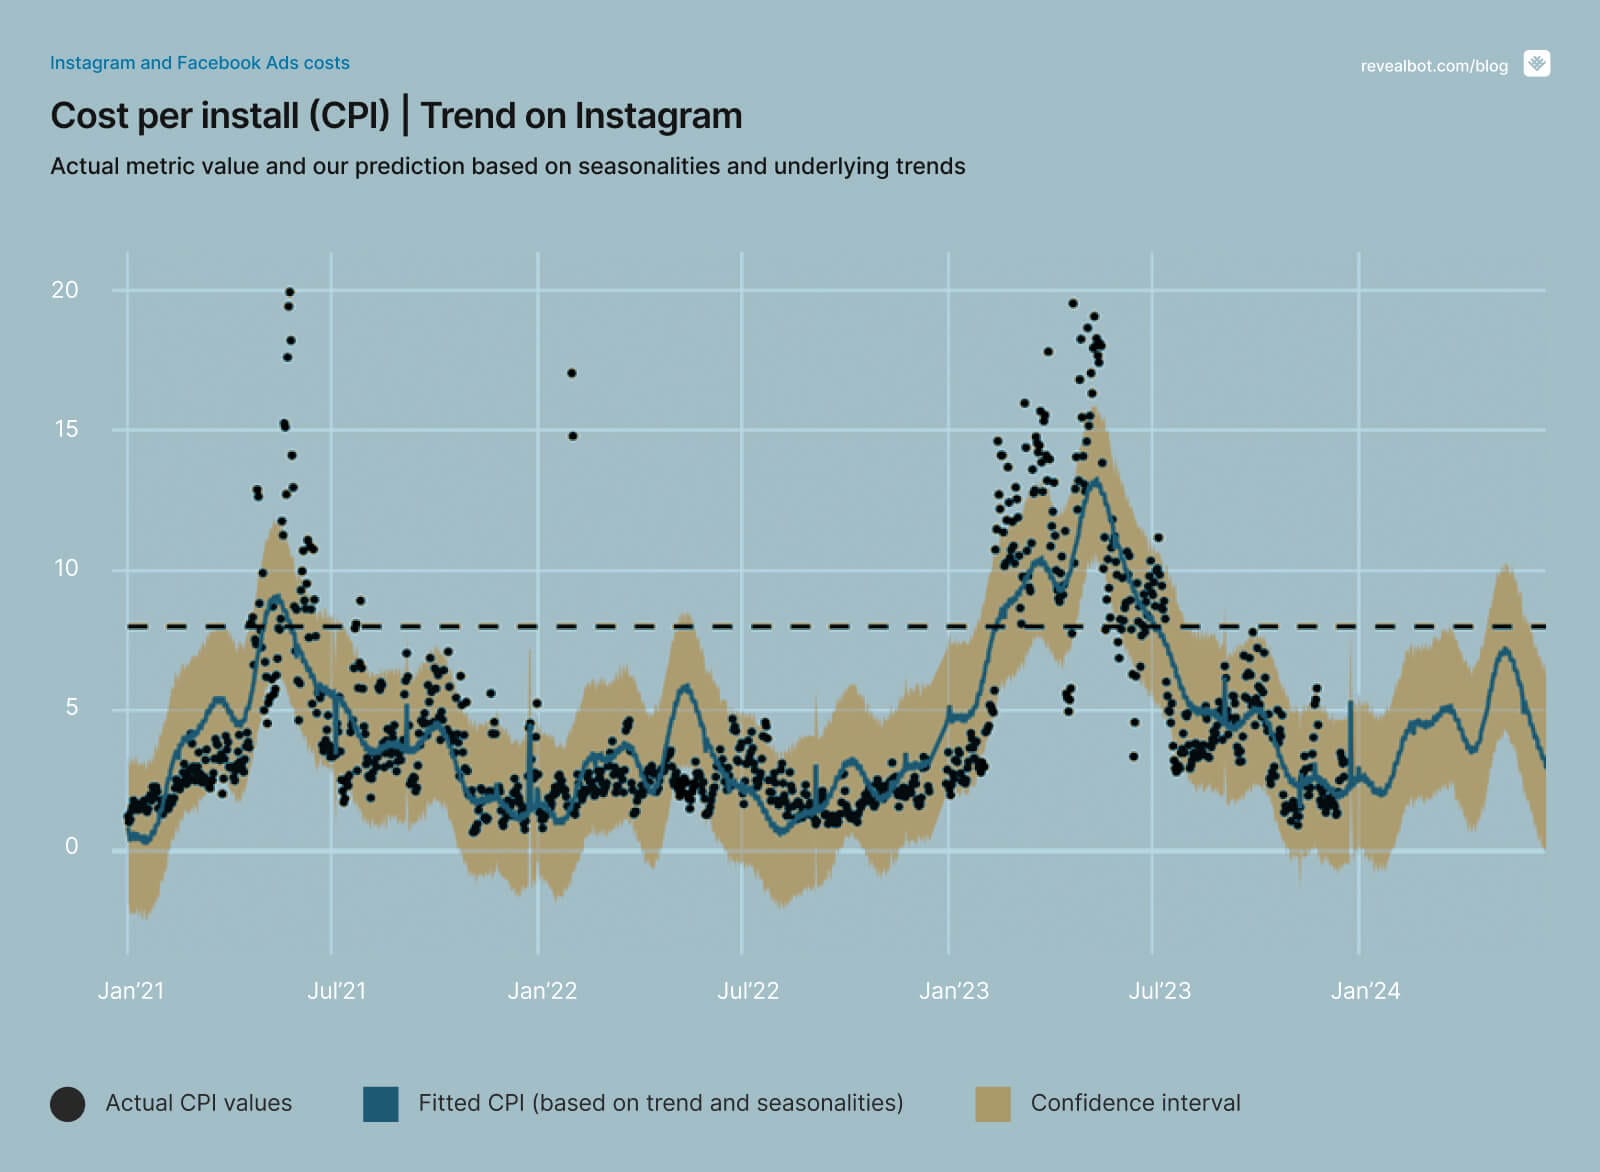
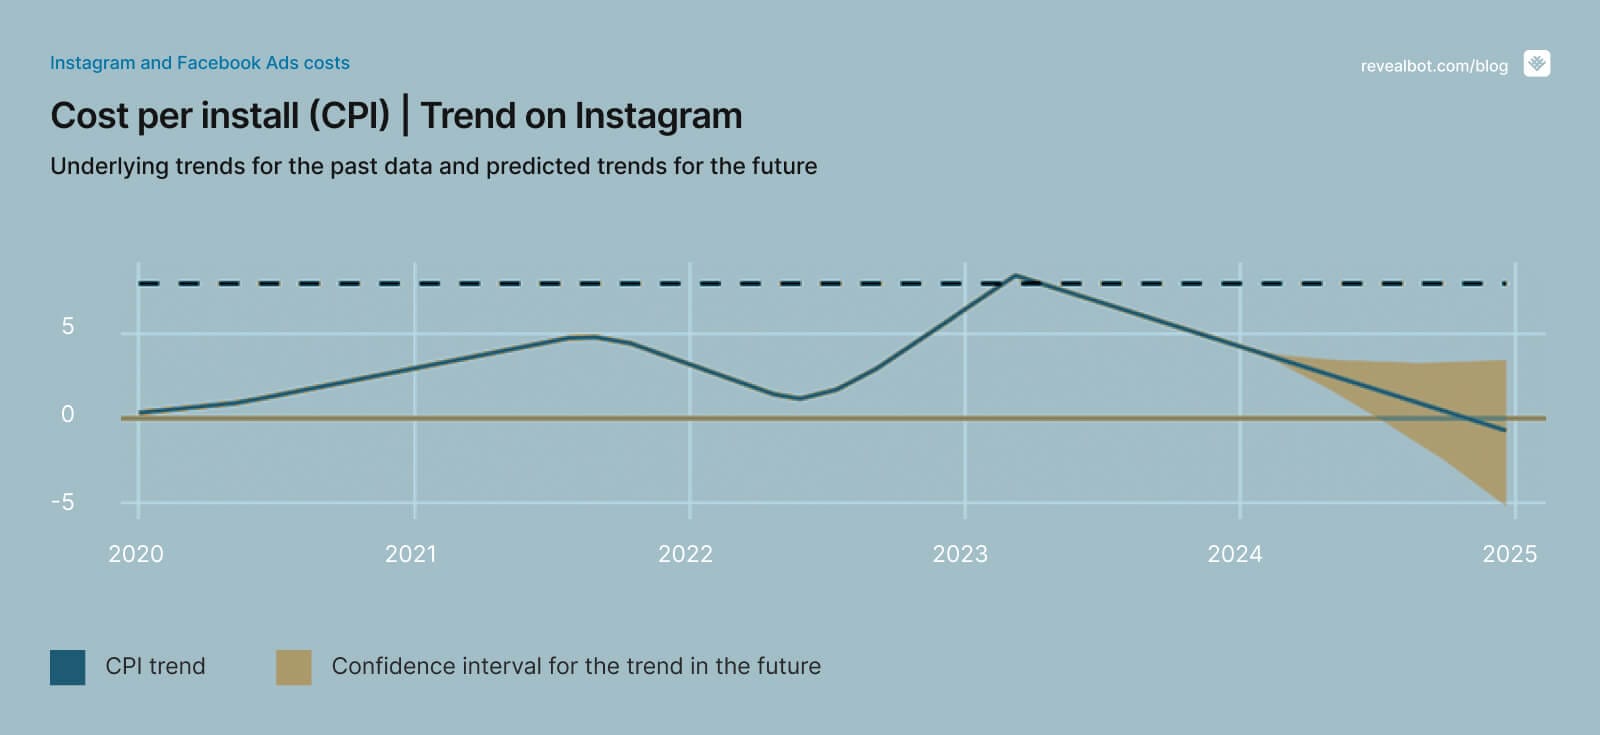
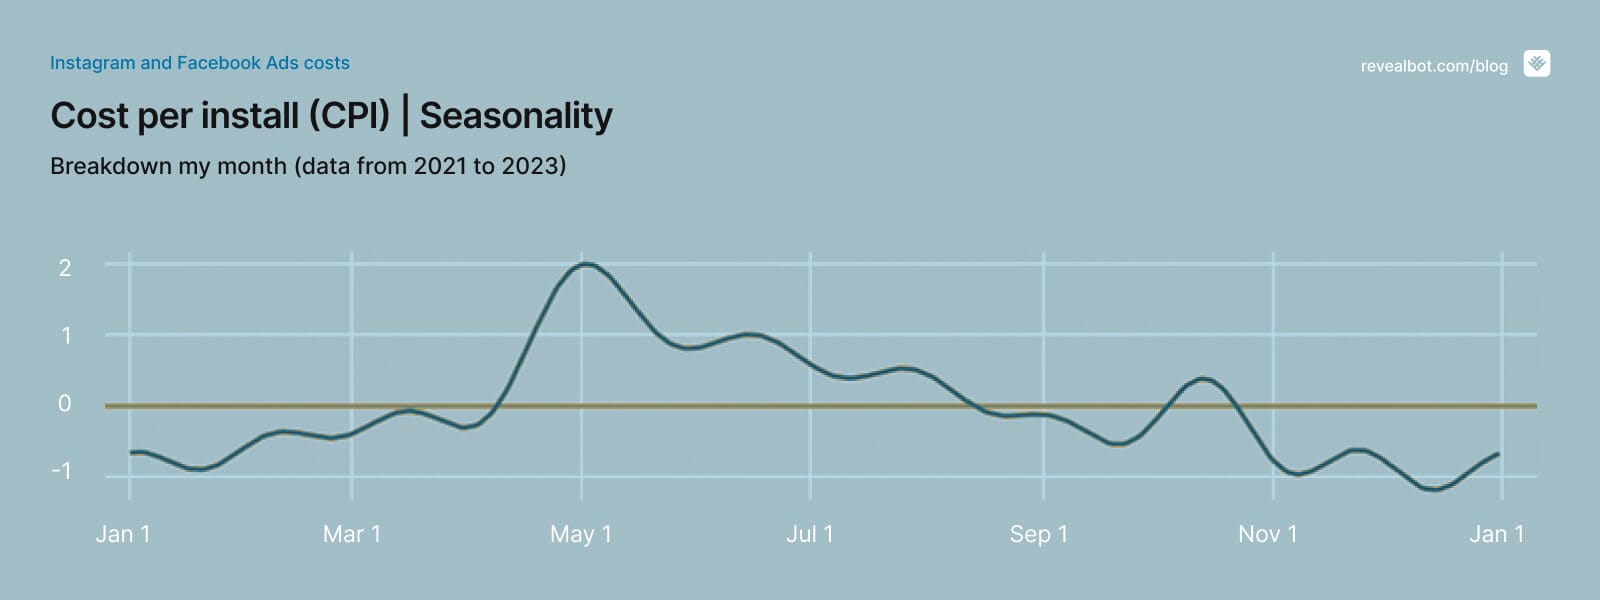
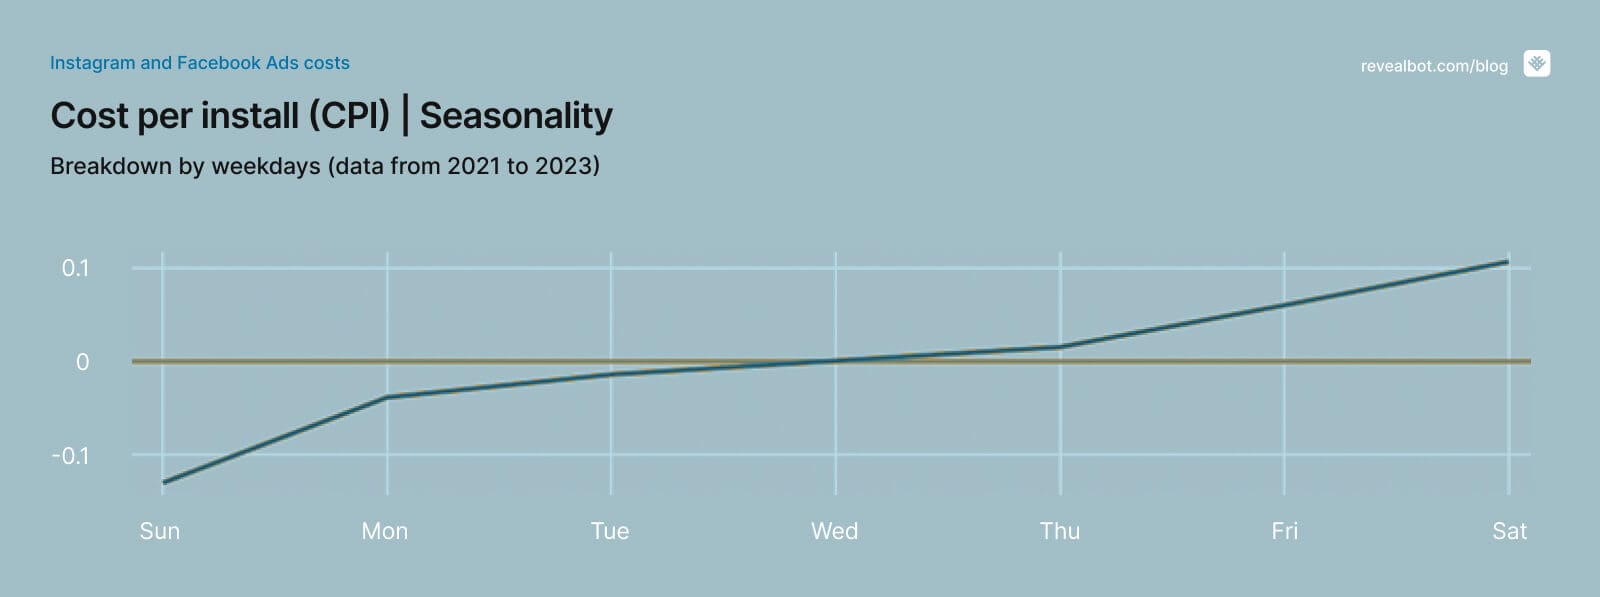
It appears that the seasonality of app installs is mainly associated with new privacy releases. Regarding weekly seasonality, we do not observe any significant changes (± $0.1) for different days of the week.
We are considering only campaigns with the lead generation objective.
After a drastic increase in 2021, the average values have remained approximately at the same level.
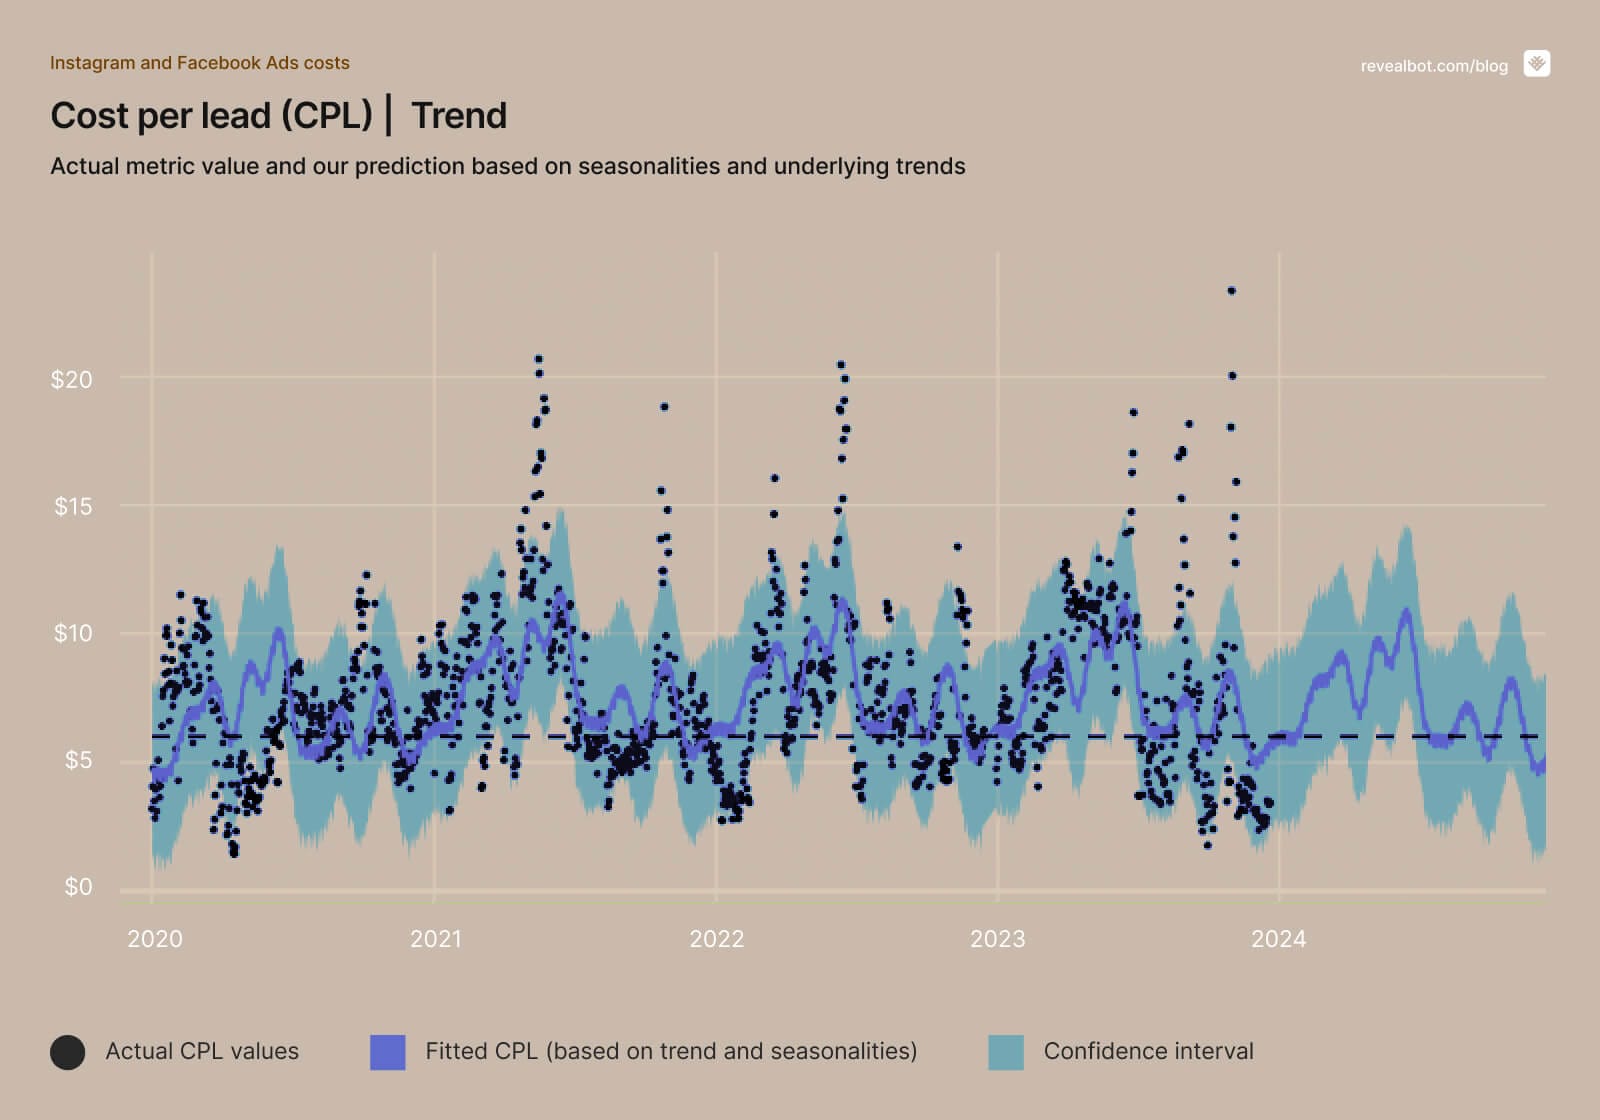
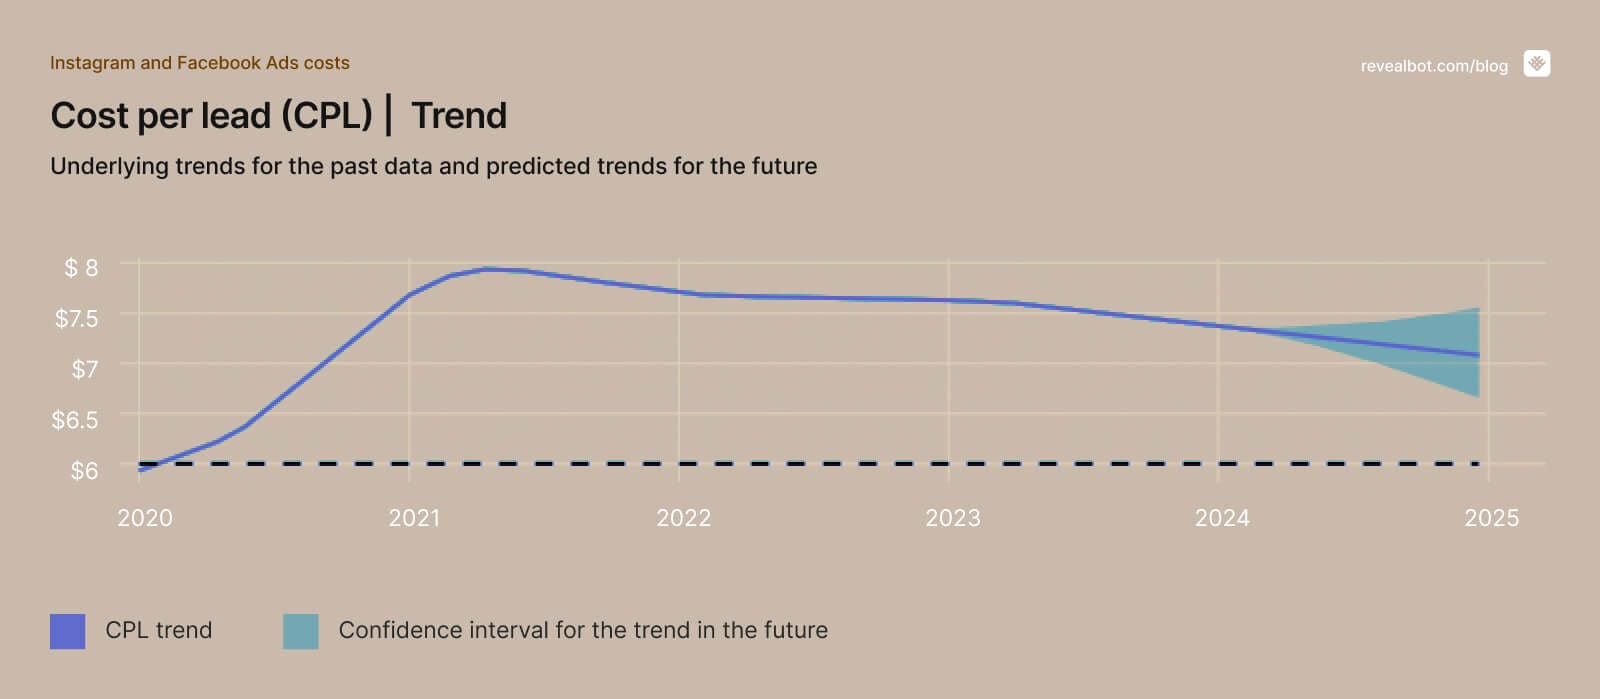
There were several peaks in the different months during the last 3 years.
Black dots represent actual CPL values, while the blue line represents the fitted seasonality line.
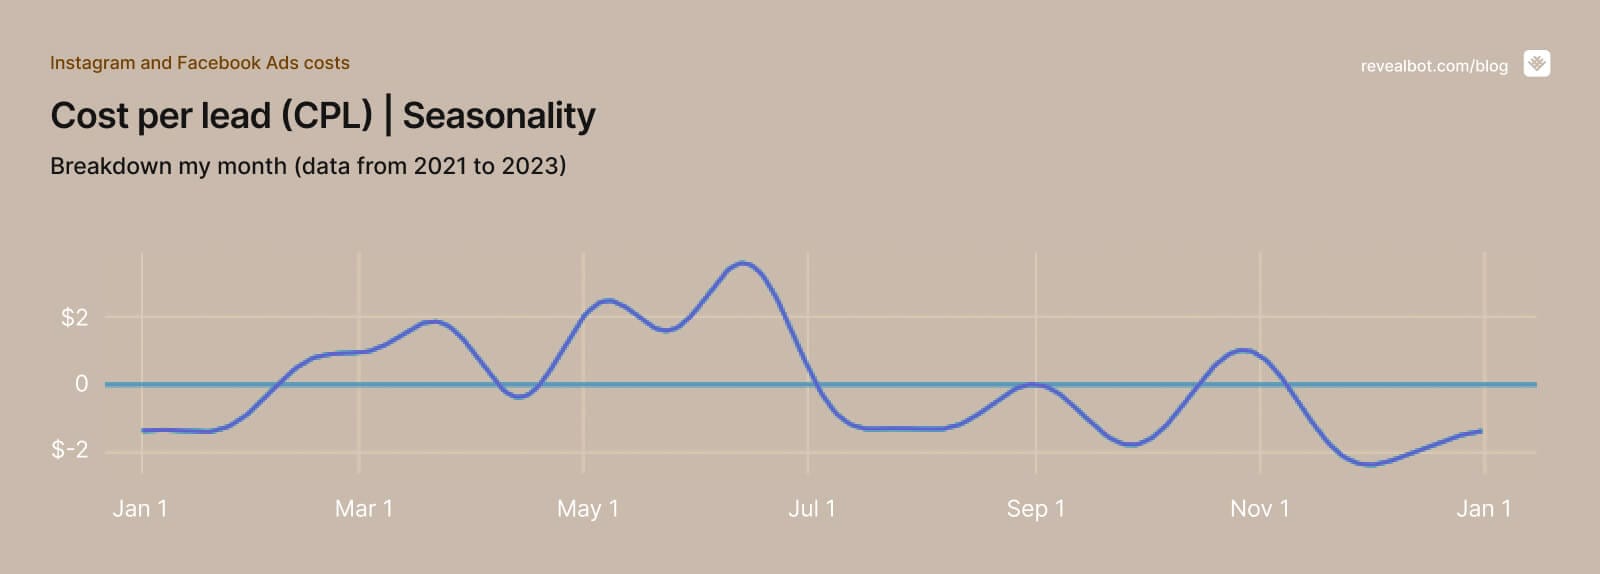
The yearly seasonality can be generalized as follows: the CPL is higher during the first half of the year, especially in the second quarter (by ~15-25% higher).
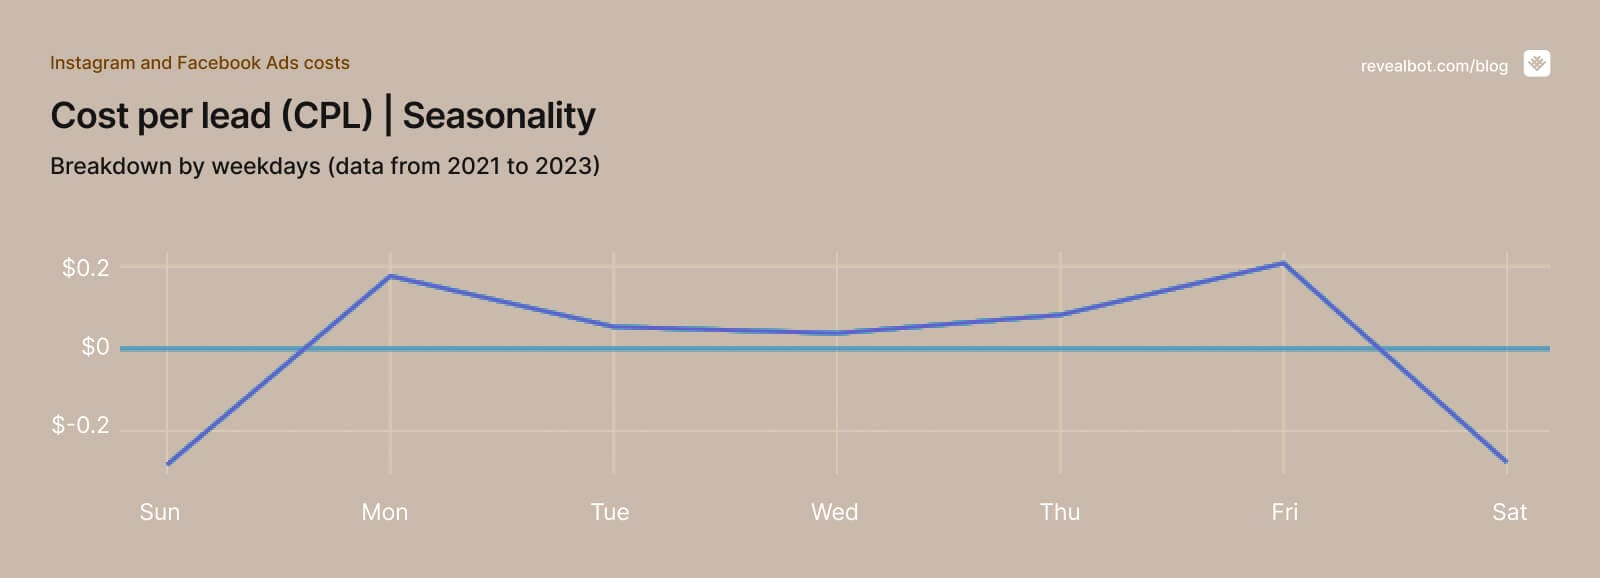
The weekly seasonality is weak, but there is a pattern indicating that leads are slightly cheaper during weekends.
Based on the trends identified in the charts, we anticipate Facebook ad costs to continue declining throughout 2024, supported by a projected rise in Click-Through Rates (CTRs). This analysis empowers you to:
This is the first of our reports, in which we plan to do a monthly analysis of these metrics, tracking the accuracy of our cost predictions for the year and monitoring market fluctuations.
Follow our blog for regular updates on the Meta advertising landscape and valuable insights to inform your marketing and advertising decisions.
Wrapped up by the sound of Patrick Watson — Je te laisserai des mots

Anna is data maestro at Revealbot, unravels patterns by day, explores by night. When not crunching numbers, she chills with friends or catches her favorite TV shows.